- Published on
Latency Metrics
- Authors

- Name
- Hoang Nguyen
Intro
When measuring the performance of a system, especially one that handles user requests, latency is an important metric to consider. It provides insight into how quickly a system responds to requests and helps identify bottlenecks. However, average latency often doesn’t tell the whole story.
This is where percentile-based latency metrics P90, P95, and P99 come in. In this post, we’ll explore what these latency metrics mean, why they’re important, and how to interpret them when monitoring system performance.
Why?
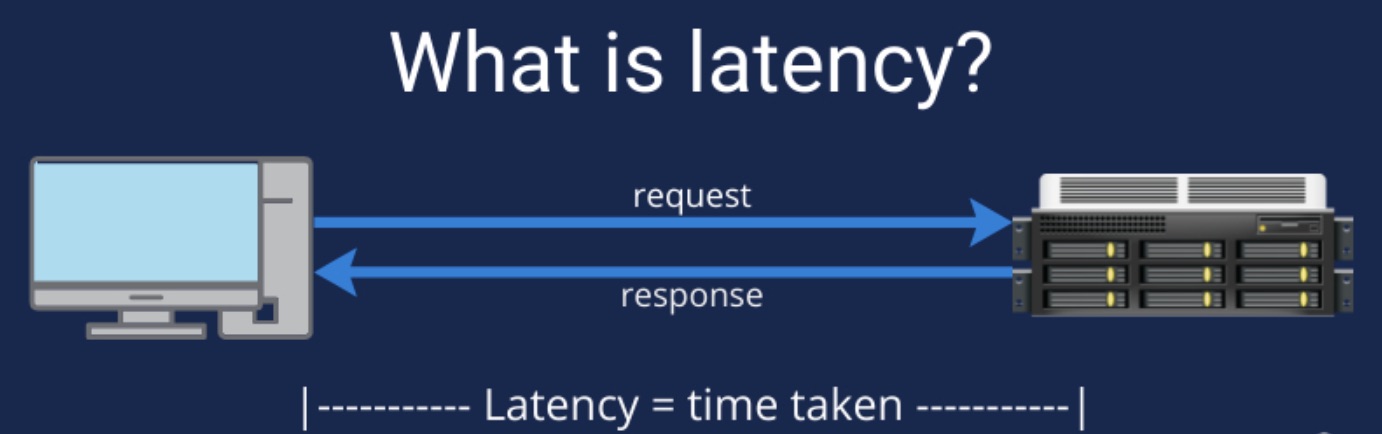
Latency is the time it takes for a system to process a request and return a response. In web applications, this could be the time it takes to load a web page, or in a database, the time it takes to return a query result. Commonly measured latency metrics are:
Average Latency: The average time it takes to respond to all requests.
Median Latency (P50): The time it takes for 50% of requests to complete.
However, focusing only on the average or median latency can mask the true user experience at the higher end of the latency distribution, where outliers can impact performance.
What?
Percentile latency metrics provide a more detailed view of your system's performance. They help you understand how your application performs for the majority of your users by revealing the slowest 10%, 5%, or 1% of requests.
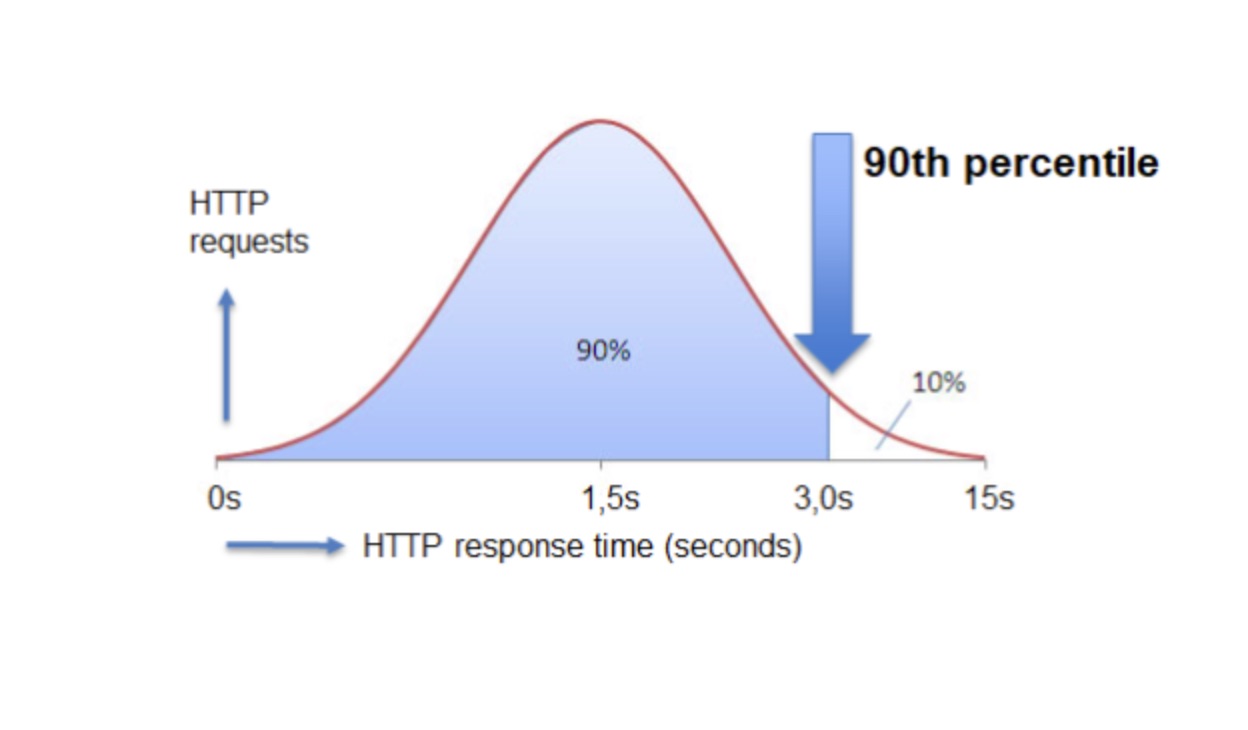
P90 Latency
Definition: The 90th percentile latency represents the value that 90% of requests fall below.
Interpretation: 90% of requests are processed faster than this time. The remaining 10% are slower.
Use Case: Useful for identifying moderately slower requests.
P95 Latency
Definition: The 95th percentile latency represents the value that 95% of requests fall below.
Interpretation: 95% of requests are processed faster than this value, and the slowest 5% take longer.
Use Case: P95 is useful for identifying significant outliers and understanding the impact of tail latency.
P99 Latency
- Definition: The 99th percentile latency represents the time it takes for 99% of requests to complete.
- Interpretation: Only 1% of requests take longer than this value.
- Use Case: Ideal for measuring tail latency, which often highlights rare but important performance issues that impact the user experience.
Benefits
Tail Latency Awareness: Focusing on average latency can mask performance issues in the tail (e.g., P99), where the slowest 1% of requests are located. These can cause significant user frustration.
Important for SLAs: Service Level Agreements (SLAs) typically set thresholds based on P99 or P95, ensuring that the majority of users receive acceptable performance.
Performance Optimization: Knowing your P95 or P99 latency helps identify and optimize the slowest parts of your system, improving the overall user experience.
Example
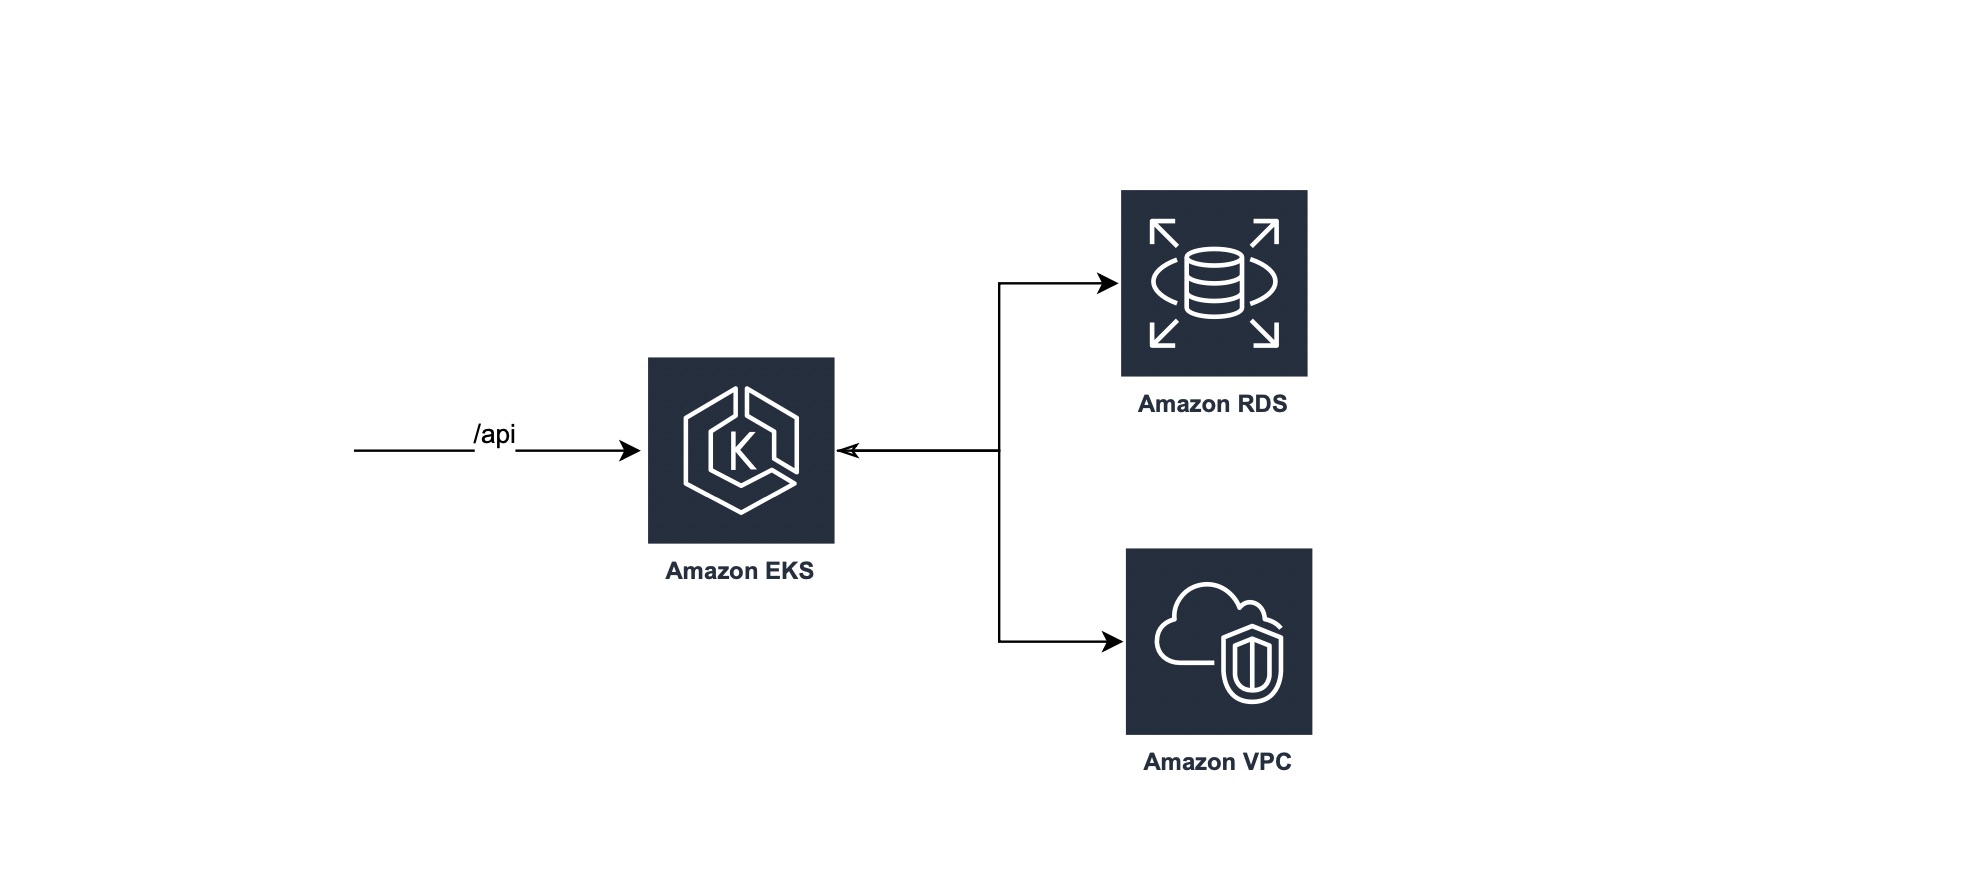
The assumption here is that the server is getting 100 request:
- There will be 99 requests that take < 120 ms
- Only 1 request takes > 120 ms
We could summarize the definition of P99 as below:
- This suggests that 99% of the API requests are faster than this value.
- Just 1% of the requests are slower than the P99 value.
How?
Set Targets: Aim to reduce tail latency to ensure that even the slowest requests meet user expectations.
Compare Over Time: Continuously monitor percentile metrics over time to identify performance regressions or improvements.
Alert: Set up alerts based on P95 and P99 latency to detect outliers that may impact the user experience early.
Conclusion
Understanding and monitoring P90, P95, and P99 latency metrics will provide a clear picture of how your system is performing for most users, especially during peak or heavy load times. These metrics help you focus on the right performance improvements, resulting in better user experiences and more robust systems.
By monitoring and optimizing latency by percent, you can ensure that your service remains responsive, even during high load or unexpected spikes.